CHAPTER 2
- MAPS
- MAPS
OBJECTIVES
STUDENTS WILL BE ABLE TO :
- Define a map
- Differentiate between maps and globes
- Identify the directions and the sub directions
- Explain types of maps and their characteristics
- Identify the elements of a map
- Measuring the distance
- Identifying the types of scale (linear, verbal)
STUDENTS WILL BE ABLE TO :
- Define a map
- Differentiate between maps and globes
- Identify the directions and the sub directions
- Explain types of maps and their characteristics
- Identify the elements of a map
- Measuring the distance
- Identifying the types of scale (linear, verbal)
We have seen that the globe is a small model of the Earth. It is the most accurate way of looking at the size, shape and location of places on the Earth. However, it is not possible to carry a globe everywhere. Why?
Because of the disadvantages of globe, we use maps.
A map is a drawing of the Earth, or a part of it, on a flat surface. Maps represent all, or a part of, the earth’s surface in miniature. They can be drawn to show the whole world, a single continent, a country, a city, your neighborhood, and even your school. They can be drawn in any size. A wall map of the world can be several times its size, and show many more details. It can be easily rolled up or folded and carried.
|
There are several types of maps in the atlas. Some of these are as follows: · Maps showing boundaries of countries and states important cities, known as political maps. |
|
|
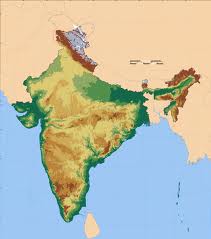
· Maps showing natural features of land such as mountains, rivers etc., known as physical maps.
|
|
|
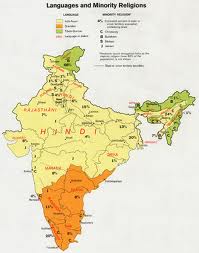
· Maps showing crops, rainfall, roads and airline routes, etc., known as thematic maps.
|
|
|
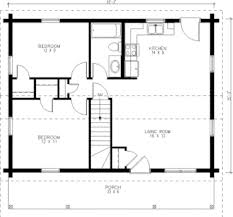
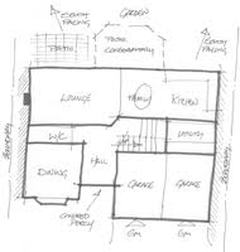
Apart from maps of geographical regions, there are also maps showing small areas in detail, like a street, a house, or even a room. These are called plans.
|
|
A map drawn without a proper scale is called a sketch. It does not have all the detailed features of an area and may not be accurate.
|
|
Importance of map: They are essential to the study of Geography since important geographical information like the position of a country or the climate of a region can be easily depicted through them. Transport routes and tourist destinations can be located on maps. Maps are important in the administration and defense of a country. They help us to understand what the land looks like when seen from above, the height of the land and the depth of the sea in different places.
Maps Vs Globe: Maps have advantage that they are easy to handle, can be rolled or folded and carried around easily. They can show more details about small areas. Whereas, the globe is bulky and cannot be carried easily. Globe cannot show minute details of a place.
ELEMENTS OF A MAP
Title: All maps have a title which tells the reader what the map is about. For example, India Roadways map
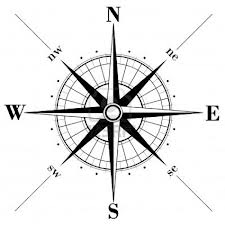
Directions: If you keep an open map in front of you, facing up, the top of the map shows the north. Opposite that, at the bottom is the south. To the right is the east and to the left is the west. In many maps, the north is also indicated by an arrow.
In between these primary directions lie the sub-directions: North-East (NE), North-West (NW), South-West (SW) and South- East (SE).
Title: All maps have a title which tells the reader what the map is about. For example, India Roadways map
Directions: If you keep an open map in front of you, facing up, the top of the map shows the north. Opposite that, at the bottom is the south. To the right is the east and to the left is the west. In many maps, the north is also indicated by an arrow.
In between these primary directions lie the sub-directions: North-East (NE), North-West (NW), South-West (SW) and South- East (SE).
Activity for finding direction using compass
http://mapzone.ordnancesurvey.co.uk/mapzone/PagesHomeworkHelp/maptivity/compassesanddirections/
Scale: A map is much smaller than the actual size. The size or distance on a map is shown by a scale. For example, the actual distance between two cities may be 100 kilometers. On the map it may be shown as 1 centimeter. Then the scale of the map is 1 cm = 100 km. This is known as verbal scale.
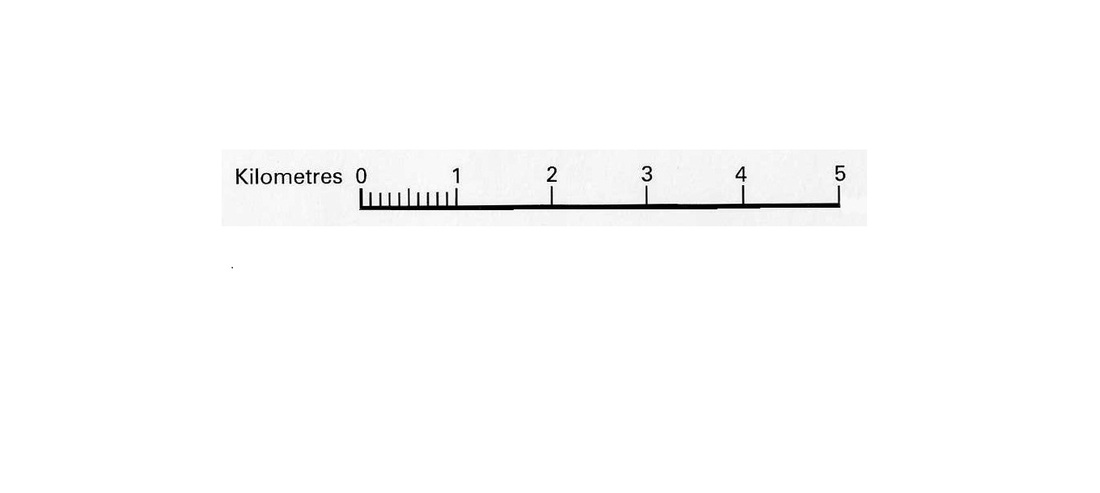
The scale can also be shown by drawing a line with numbers marked on it at regular intervals. This is known as linear scale.
The scale can also be shown by drawing a line with numbers marked on it at regular intervals. This is known as linear scale.
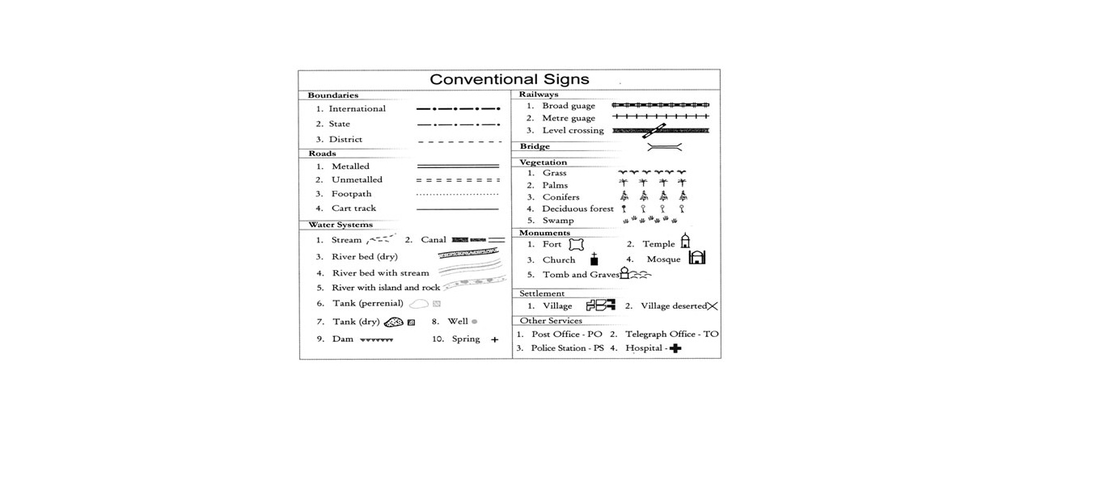
Map legend or Key:
The key or legend tells us about the colours, symbol and patterns used on the map.
Colours: Certain standard colours are used to show features such as oceans, seas, mountains, plains, deserts, etc. on a physical map.
· Water bodies are always shown in blue. Deep blue shows deep waters and light blue shows shallow waters.
· Mountains and highlands are shown in brown and yellow. Dark brown shows high mountains. Light brown shows lower mountains and hills. Yellow shows plateaus.
· Plains are shown in green.
On a political map different colours can be used to show different places.
| readingmaps.ppt |
Symbols:
Symbols are used to indicate different features such as international boundaries, state boundaries, district boundaries, railway lines, rivers, roads and capitals. Patterns are also used to depict information about the regions shown in the map.
|
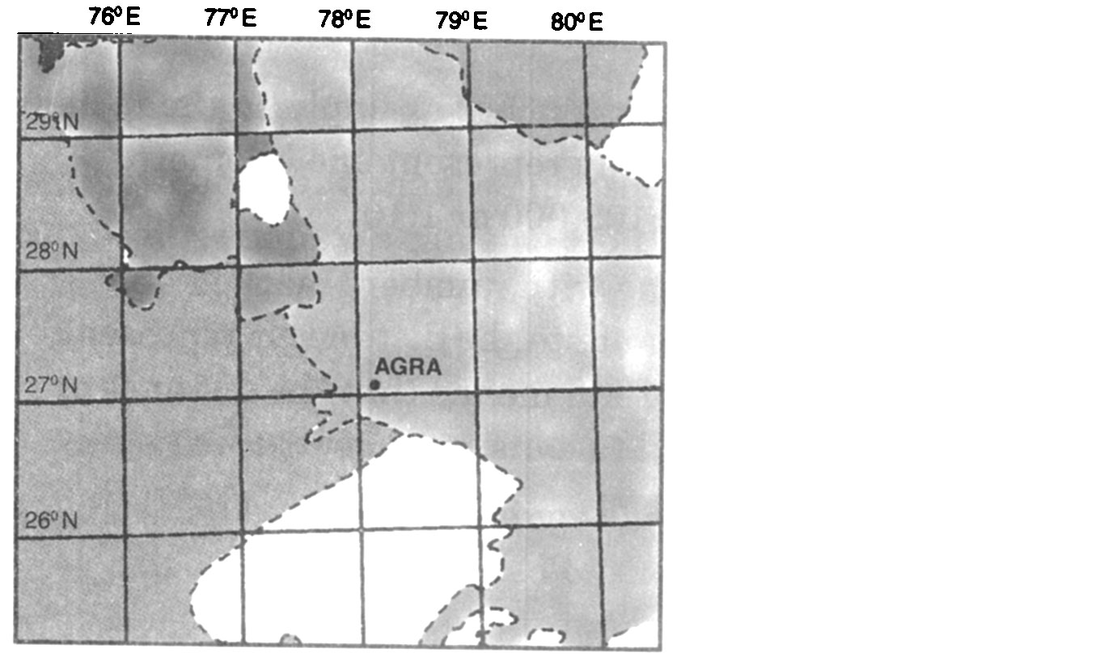
GRID SYSTEM
Meridians of longitude and parallels of latitude form a useful grid. They help us to find places easily. The lines of latitude and longitude are marked in degrees. To find a place on a map, we can look at a grid reference. |
|
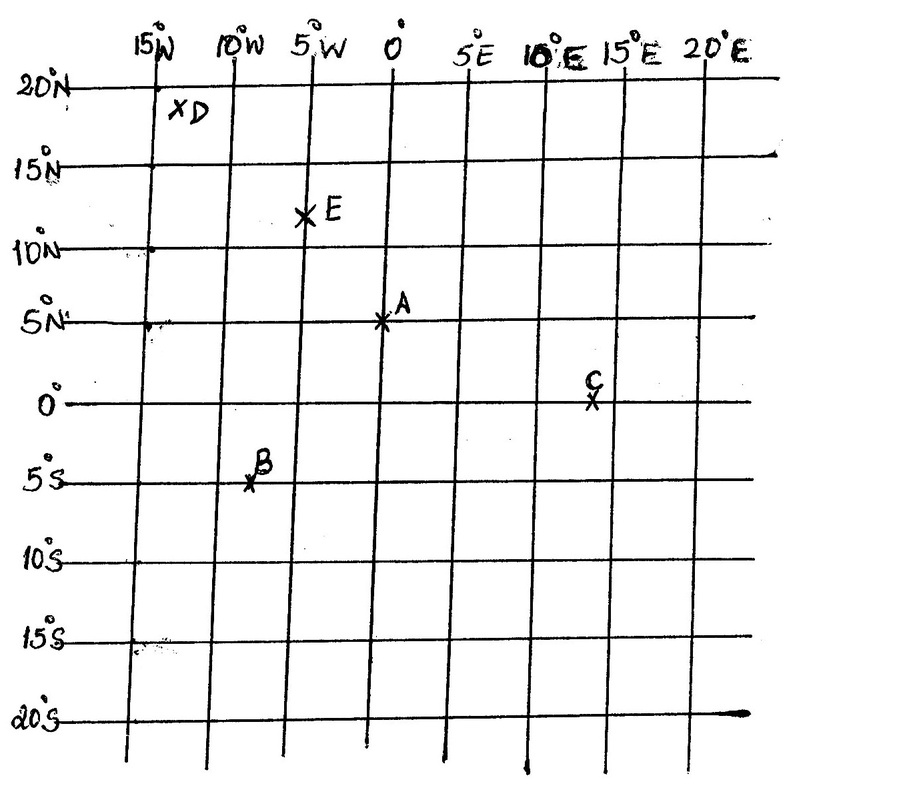
Four directional grids:
This grid system will have a network of lines representing the latitudes and longitudes. The horizontal line at the center of the grid represents the equator. Similarly, the vertical line at the center of the grid represents the Prime Meridian. These two lines criss-cross each other to create four quadrants.
The Prime Meridian divides the world into eastern and western hemispheres. Hence the longitudes east of the Prime Meridian will represent the eastern direction. The degrees will be marked with E. The longitudes west of the Prime Meridian will represent the western direction. The degrees will be marked with W.
The equator divides the world into northern and southern hemispheres. Hence the latitudes north of the equator will represent the northern hemisphere. The degrees will be marked with N. The latitudes south of the equator will represent the southern hemisphere. The degrees will be marked with S.
Here, City A is located at 0° and 5° N latitude. Meaning it is located on the Prime Meridian and 5 degrees north of the equator.
|
|
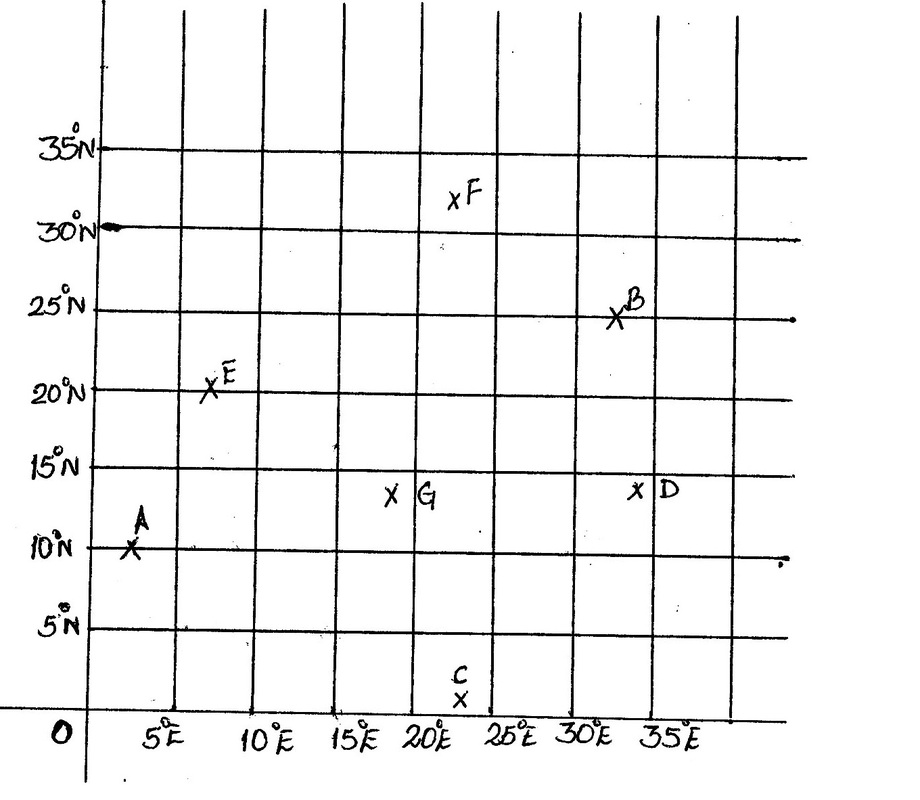
Two directional grids:
This grid system will have a network of latitudes and longitudes criss-crossing each other. But this grid will consist of only two directions. North and east; North and west; South and east or South and west. With respect to the directions the placement of the Prime Meridian and the equator will change.
For example: In the given grid, the directions represented are north and east. The intersection point of the Prime Meridian and the equator is named 0° from which the marking of the latitudes (in the northern direction) and longitudes (in the eastern direction) begins. City A is located at 10°N latitude and 3°E longitude.
|
|
|
|